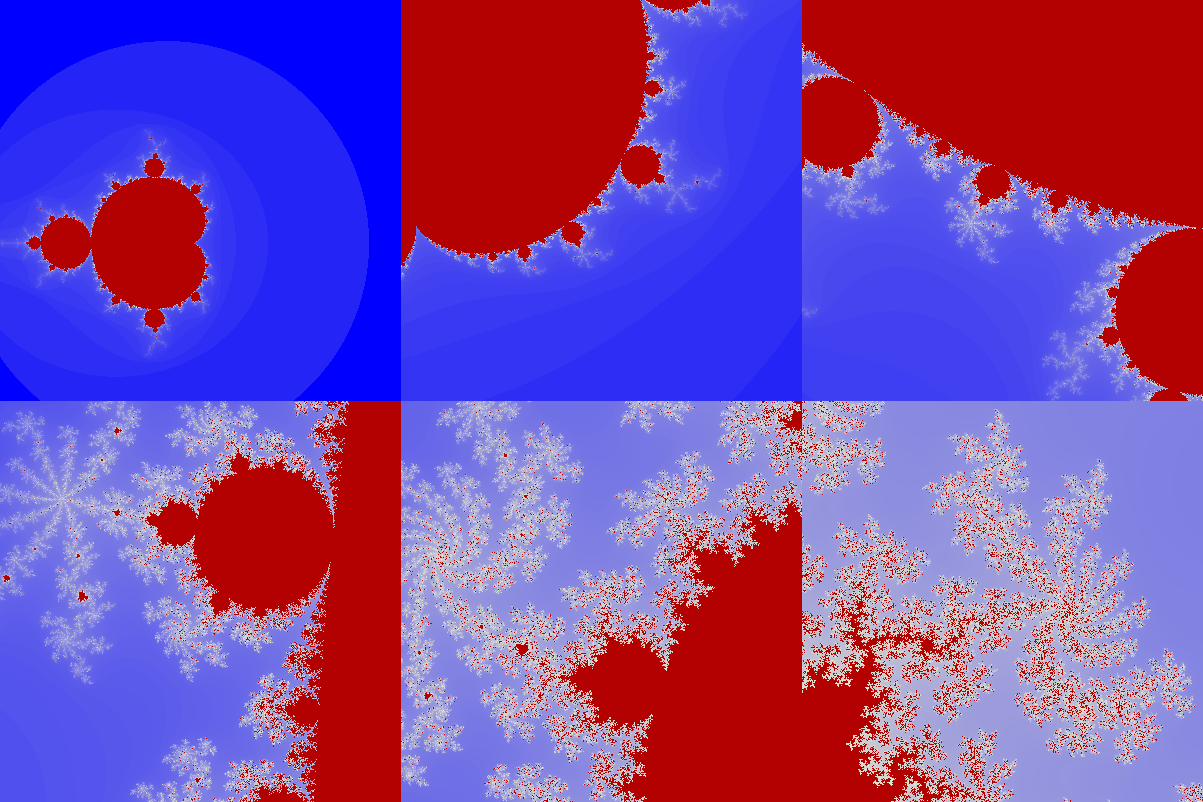
We thought this was a good year for going back somewhat to our careers, and producing a more overtly mathematical card. So this is our …
First things first. This is not the place for a detailed technical description of the Mandelbrot set; there is a decent article on, e.g. Wiki. There is a less technical guide to what is going on below the animated zoom. It's worth also looking up fractals. The referenced articles also contain information about how to calculate and plot fractals on a computer. As far as we know, none of that explains how the gentleman in red managed to gate-crash our card. If all you want is lots of pretty pictures, and those on Wiki are not enough for you, there are plenty available on the web; be warned that you can soak up arbitrary amounts of time on the quest.The program actually used by us to generate our pretty picture is similar to one originally written by Marcel van der Veer, with whom Andy has corresponded for many years. The current state of that program can be found on Marcel's web site. If you want the [much tweaked] program used by Andy for our card, just ask, but if you want to run it, you will need to install an Algol compiler.

Note that the red specks, looking like dust on the screen or on the
card, are in fact joined-up parts of the Mandelbrot set.
This can be shown by going to higher magnification or resolution,
but the nature of the set means that this is a never-ending process,
and as existing specks join up and enlarge into near-copies of the
complete set, new ones appear!
Here is a number line:
Ignore the colours and dots for a moment.
So, it's simply a line on which we mark the positions of some
numbers of interest, like a double-ended tape measure.
On such a line, there is no very interesting distinction
between a number and a point, and we can use these
words interchangeably.
What can we do with it?
For present purposes, one idea is to investigate what
happens to numbers if we do the same thing again and again
[and again and …].
For example, we could add 1:
Well, that's not very exciting.
It's just counting.
We could start anywhere, our numbers simply march off to the
right until they disappear into the sunset [or sunrise if the
arrow on the line points to the east].
Adding numbers other than 1 makes little difference except that
we march off into the distance at a different rate.
OK, suppose instead of adding, we multiply;
for example, we could double the numbers each time:
So, starting at 1 we march off to the right faster and faster,
doubling our stride at every step.
That's not quite all there is to be said;
if we start at 0, we get stuck there [so 0 is said to be
a fixed point of the process], and if we start with,
say, -1, then we march off to the left.
If we multiply instead by a fraction such as ½, then
we get slightly, but only slightly, different behaviour:
and it's easy to see that no matter where we start, the numbers
close in on 0, though never actually getting to 0 unless we start there.
We can try something a little different again.
Suppose we square the number we're at.
So, for example,
Why is this more interesting?
The numbers just get bigger more quickly?
Well, yes; big numbers get very big and then ginormously big
quite quickly.
On the other hand, small numbers multiplied by themselves get very
small and then ginormously small equally quickly.
The situation is that shown in the picture of a number line;
if you start in the red part of the
line, then your sequence of numbers closes in on 0;
whereas if you start in the blue part
the numbers get bigger.
There are now two fixed points, at 0 and 1, and a boundary point
at -1, shown by the dots on the number line.
But we freely admit, this still isn't very exciting, and we're
a long way from the Mandelbrot set.
The reason for the boredom factor is that the number line
is so one-dimensional.
You can go left; you can go right; you can do so quickly or slowly;
but that's all.
You can't get off the line and explore; you're stuck on the tram.
So, what we need is …
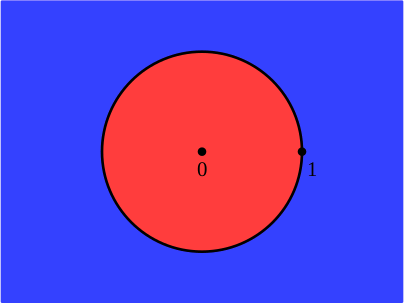
Here is an example of a number plane:
This is actually the two-dimensional version of the previous picture.
As before, there is no very interesting distinction to be made
between numbers and points.
Again, we are squaring numbers, and colouring red
the points that spiral in towards 0, and blue
the points that spiral out to great distance.
Again, there are two fixed points at 0 and 1 that square to themselves,
and the boundary between red and
blue is a circle of radius 1.
Points on the circle square to other points on the circle, but not
[except for 1] to themselves.
“Wait a minute,” you are perhaps saying;
“what does it mean to square a point?
How do you multiply a point by itself?”
The answer is that we have to re-define what is meant by
the basic processes of arithmetic.
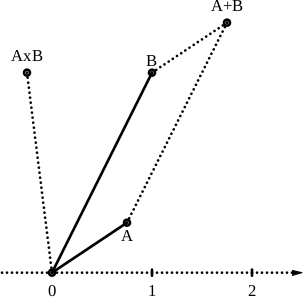
Here are the rules:
[Note that the size of A in the figure is slightly
less than 1, while the size of B is somewhat over 2,
so the size of A×B is just over 2, and its
angle is 97.1°, compared with 33.7° and 63.4°
for A and B respectively.]
So we can now confirm the previous picture.
With repeated squarings, small numbers [with size less than 1]
become smaller and smaller, homing in on 0;
large numbers [with size greater than 1] become larger and larger,
moving further away from 0;
and numbers with size 1 stay at distance 1 from 0.
So far, that picture looks a bit like a rather boring national
flag for some new state, or like one of those abstract paintings
that get hung up on the walls of hospital corridors and
hotel bedrooms to exude calm.
But this is deceptive.
Although points with size one stay on the circle of radius 1,
when you square them, they change angle, and so move round.
For example, the point with angle 10° moves to angle
20°, then to angle 40°, 80°, 160°, 320°,
640° and so on.
But 640° is exactly one complete turn [360°] more than
280°, so we're at the same angle as 280°, which doubles
to 560°, same as 200°, which doubles to 400°, the
same as 40°, and we've been there before.
So after the first two doublings, the sequence of angles
repeats indefinitely.
If the starting angle is an exact fraction of a turn, then the
above behaviour always happens.
In 360°, there are only a finite number of different fractions
with any given denominator [the number on the bottom of the fraction].
So, if you keep doubling the angle and ignoring completed turns,
then eventually one of the numerators [on the top of the fraction]
must repeat, and thereafter so will the cycle between repeats.
But there are also numbers that are not exact fractions.
These are the
irrational numbers,
discovered somewhere around 500BCE by the Pythagoreans.
These followers of
Pythagoras
[yes, that Pythagoras, of the theorem about
squaws on hippopotamuses] believed, as do we all,
that the Universe is governed by mathematics, but also
that all mathematics was about the counting numbers,
1, 2, 3, …, and ratios [fractions] thereof.
They had one outstanding success;
musical harmony is indeed governed by simple ratios.
But then it was discovered that the ratio between
the diagonal and the side of a square is not a fraction.
By [very dubious] repute, the discoverer was one
Hippasus, who was
thrown into the sea for his trouble.
Be that as it may, the discovery rather mucked up the
basic belief of the Pythagoreans,
who didn't even have the escape route of millennial cults,
who when due dates come and pass without incident can simply
claim that there was some mistake and the end of the world
has been re-calculated to be ….
Note that irrational is a sort-of pun;
it means both ‘unthinkable’ and ‘not a ratio’.
An irrational starting angle can never repeat, but instead
keeps going round and round, passing arbitrarily close
[e.g. to within a billionth of a degree] to each and
every point around the circle, without ever hitting a
rational angle.
We're now surprisingly close to the Mandelbrot set.
All we have so far is straight lines and circles.
But the next idea, instead of always adding or always squaring,
is to alternate these steps, and that is what gives us the
extra complexity of the set.
In other words, first think of a [two-dimensional] number.
Starting from that number, square it, then add the number we
thought of, square, add, square, add, square, add, ….
If the number ‘escapes’, colour it
blue;
if it never escapes, colour it red.
Rinse and repeat for all possible starting points
[inside a computer, that means for each pixel of the picture].
That's it. That's the set.
For our card, we shaded the blue between
a rather dark blue and a very pale blue, almost white, depending
on how many steps it took the computer to establish that
the point would escape;
that gives a prettier effect than a stark blue.
After that, it's a matter of how many pixels you can devote to
the problem — 2000 dots per inch in each direction is good
going — and how much time you want to spend.
That still leaves us with some questions.
For example, why does this one extra step produce so much
complexity?
The answer seems to be that this complexity is normal
in mathematics.
It seems otherwise primarily because we can't really cope
with it.
We, including mathematicians, physicists and other scientists and
engineers, largely stick to what we can manage.
We draw straight line and circles, simple waves and steady
growth or decay, or areas and solids bounded by such things;
we do statistics by working with averages and error bounds
because they're easier than the raw data.
Unknown to us in the pre-computer era, lots of science was
hiding away in the ‘too hard to handle’ drawers
of our filing cabinets; some of it has emerged over the
past forty years or so, and some is quite pretty.
The behaviour of ‘square and add’ was
investigated much earlier [notably by
Gaston Julia and
Pierre Fatou],
provoking some interest but then largely abandoned
as too difficult.
Also, how do we know that a number does or
does not escape?
‘Does’ is easier.
If you're more than two miles from home, then your
‘square’ is more than four miles from home,
and walking your original distance is not going to get
you even half-way back, so you're now further away,
and repeating the process just spirals out.
So size 2 is critical, giving a simple test.
Many programs, including Andy's, do little else;
follow a number through, say, 1000 repeats, and if it
hasn't gone to size 2 by then, we assume it never will.
For the magnifications and resolutions here, that's
enough [it turns out].
You can also look for fixed points and cycles, like the
repetitions we found for the simple squarings.
That requires some algebra and some calculus to see
whether numbers are spiralling towards or away from
these cycles; there is much more in the articles
already referenced.
It's also possible to run the processes backwards;
instead of ‘square and add’, we
‘subtract and square root’.
There is plenty of scope for pretty pictures this
way too!
If we can have two-dimensional numbers, can we have
three-dimensional numbers?
The answer is that you can, but the result is not very like
a number.
Points in space are three-dimensional [until we get to some
advanced and controversial physics], but this is usually
expressed in terms of three co-ordinates [e.g. how
far to the east, to the north, and up we have to go to get
to the point from some point of ‘origin’].
The buzz-word for this is
vectors,
but vectors are then combinations of numbers rather than numbers
in their own right.
Further discussion is beyond the scope of this page!
Four-dimensional numbers, otherwise known as
quaternions,
are much more relevant.
There are two reasons for this.
One is that you can re-define the basic operations of arithmetic
on them, in a similar way to what we did with
‘complex’ numbers.
The other is that Einstein's theories of relativity relate
to events, by which Einstein meant a combination of
a place and an associated time.
In these theories, time corresponds to points on a number line,
and the other three dimensions to a place.
So each event corresponds to a quaternion.
Quaternions were all the rage in the late 19thC, but then went
rather out of fashion.
The world of physics has partly re-discovered them, and
moved on to more exotic dimensions, which are hard to
visualise in the real world around us.
There are other ways to move on from a number line to
different sorts of number.
Mathematicians also talk about
surreal numbers and
hyperreal numbers.
Further discussion of these is well beyond the scope of
a Christmas card, however!
It is perhaps worth noting that straight lines, circles, flat
planes and so on are quite rare in nature.
More usually, objects are quite knobbly or rough, and of a
complicated shape when examined in detail.
These complicated shapes usually come from large numbers of
small objects [air and water molecules, cells, birds, …]
coming together, and following relatively simple rules, to form
large objects [clouds, animals, flocks, … respectively].
Self-similarity [parts of something looking like a smaller version
of the whole] and chaotic behaviour [such as the notorious storms
allegedly caused by butterflies flapping their wings in Brazil]
are the norm.
So the complicated shape of the boundary of the Mandelbrot set
should perhaps come as no surprise, even though the way it is
constructed is quite simple.
[See the articles referenced earlier for how self-similarity and
chaos are seen when you explore deep into the set.]
The real world is ‘like that’;
mathematics is reflecting the same phenomena.
Copyright © Andy Walker and Anne Lomax, 2023.
The number line

Two-dimensional numbers


Digression
The Mandelbrot Set
Digression 2
Digression 3